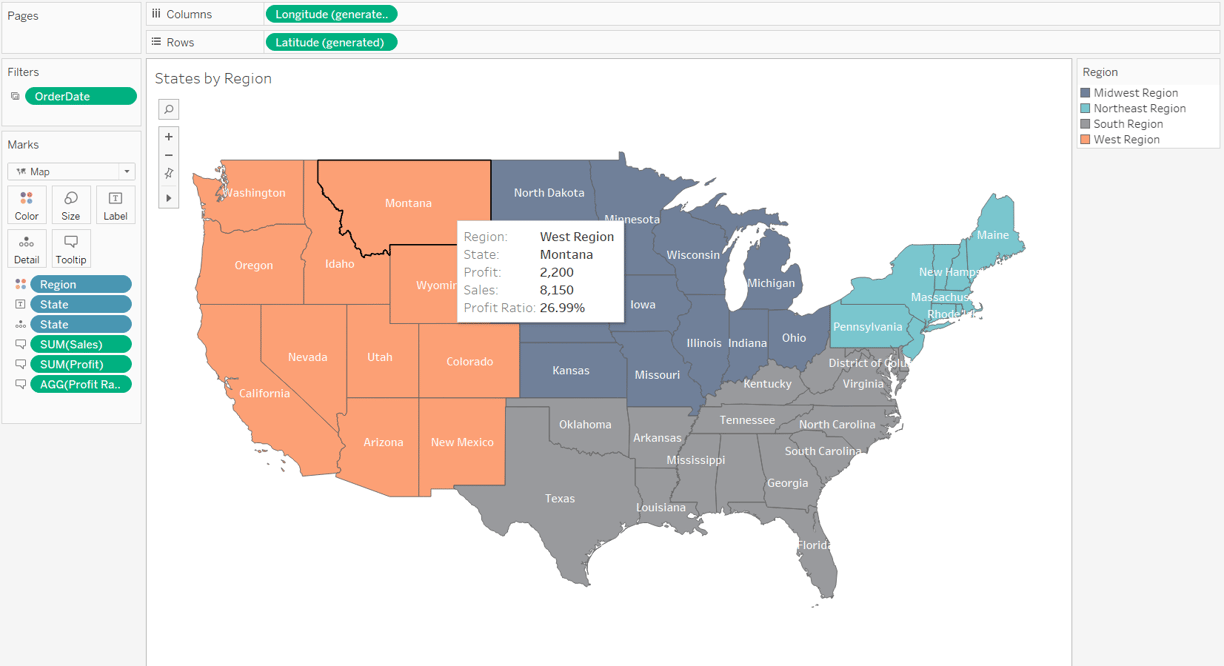
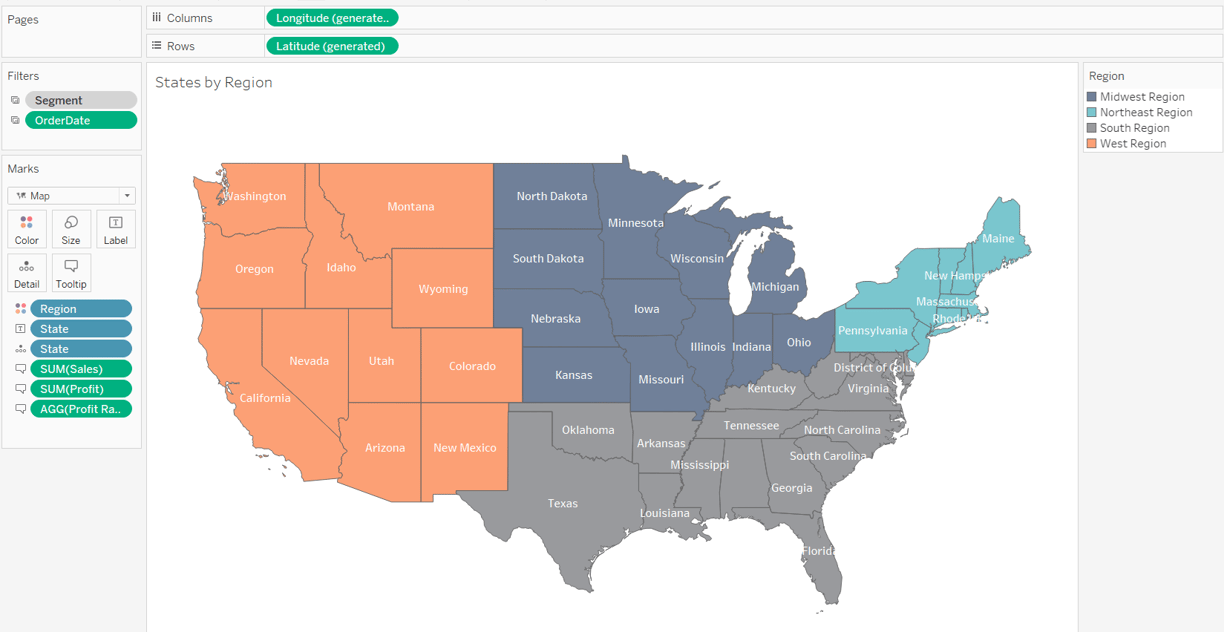
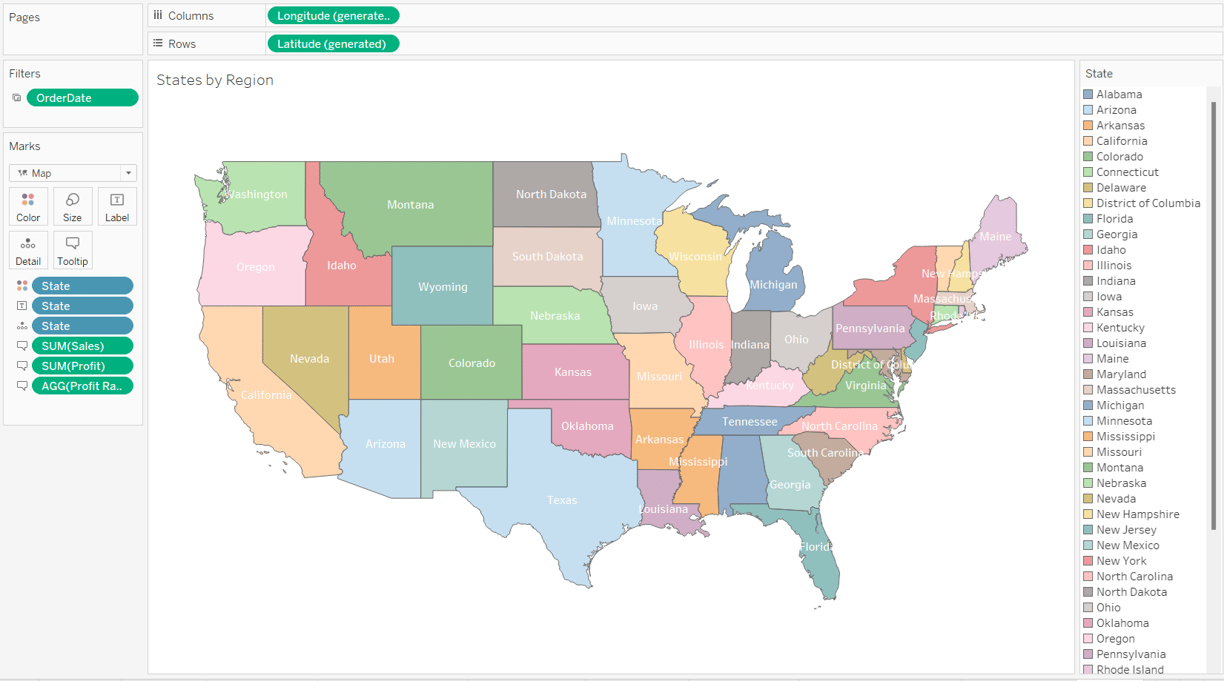
Based on the postal code of customers in data source, we can aggregate data in each State of the United States. We can color the map based on a discrete dimension such as State or Region


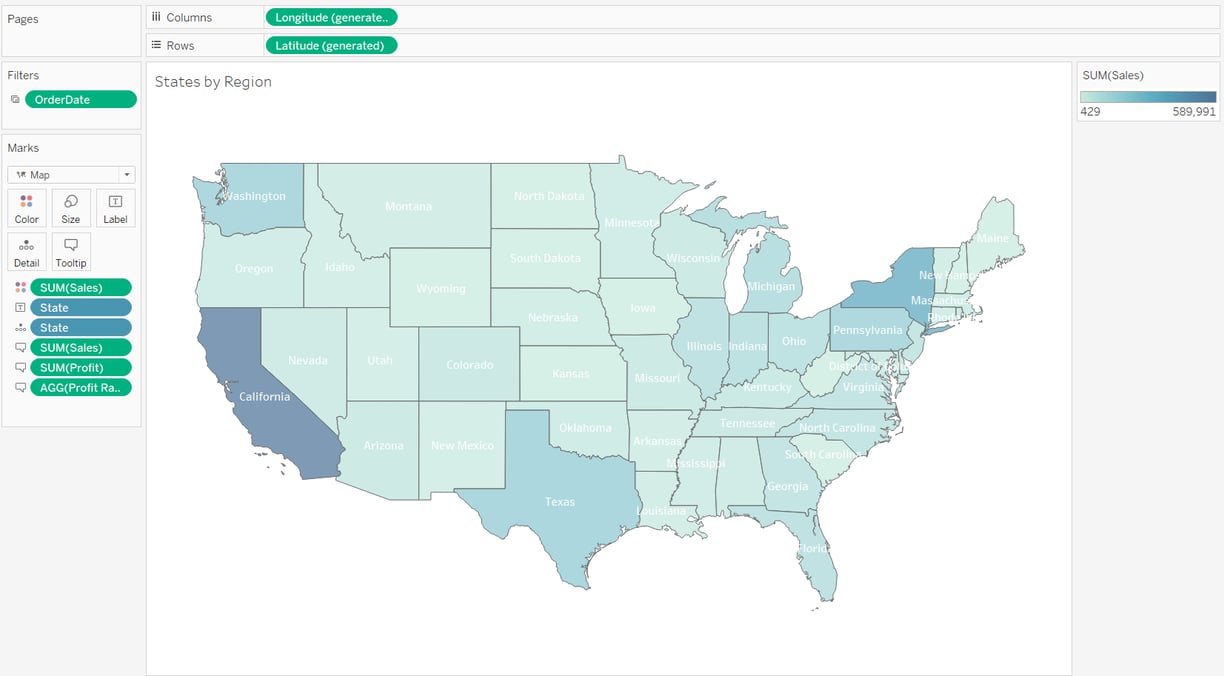
We also may color the map based on a continuous measure such as Sales or Profit.

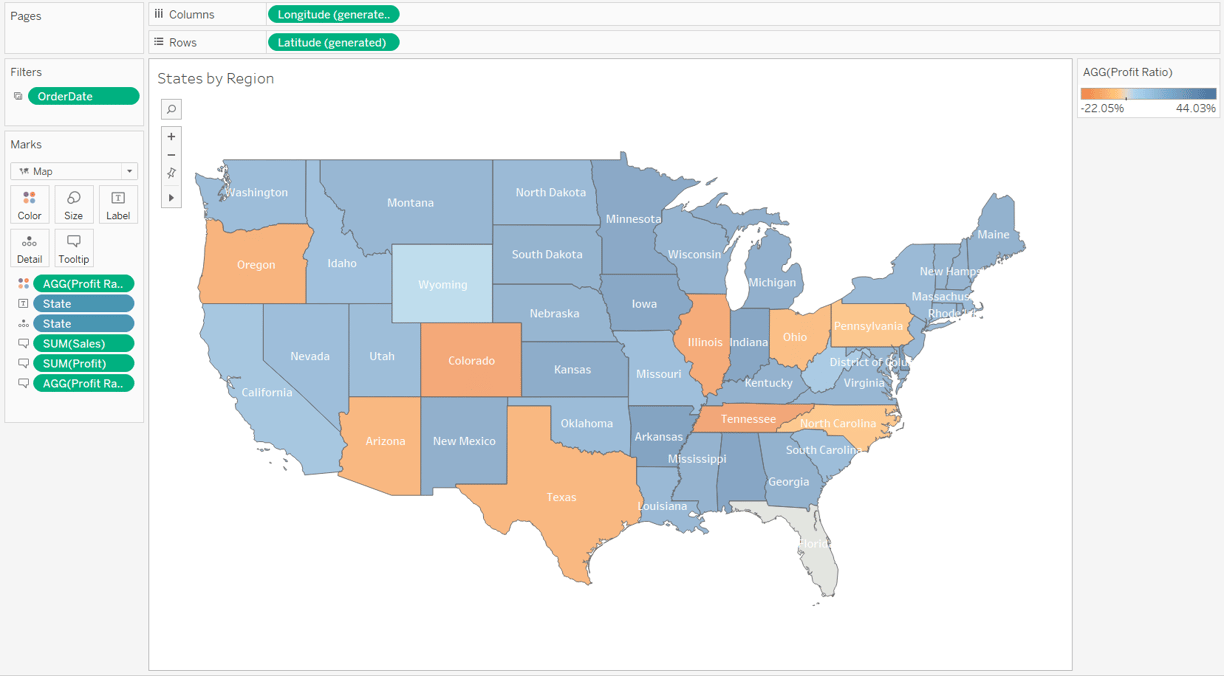

A good idea is coloring the map based on Region (less crowdy). Then adding other information in the tooltips
